What I built
I built an out-of-sample evaluation and transfer-learning framework for 153 Jensen-Kelly-Pedersen (JKP) equity factors across 22 emerging and 23 developed markets, pairing Monte Carlo size/power audits with turnover-penalized portfolio tests.
Research question and benchmark discipline
Question: Is the predictability of equity factor returns documented in developed markets present in emerging markets, and does a model trained on developed-market history forecast emerging-market factor returns out of sample, net of trading costs?
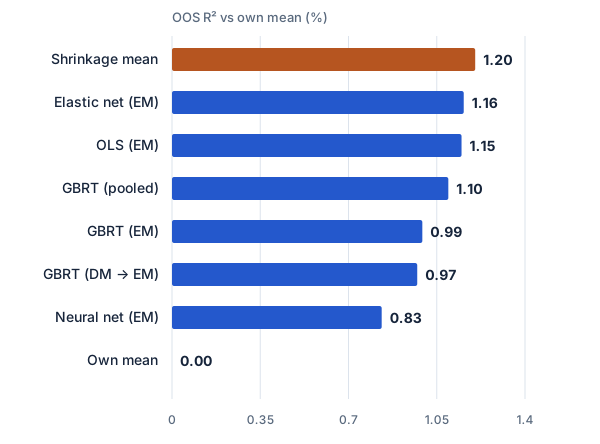
In a multi-country factor panel, each country-factor mean is estimated from a noisy history. Testing against each series own expanding mean (hist_mean) conflates time-series factor timing with cross-sectional pooling of unconditional premia. On known-truth synthetic panels with zero predictability, testing against the own mean rejects 87.5% of the time; replacing it with a regional shrinkage mean (shrink_mean) restores nominal 5.0% size while keeping 92.5–100% power.
Capabilities demonstrated
- Audit benchmark size and power on synthetic multi-country panels before opening real emerging-market holdouts.
- Train pooled OLS, Elastic Net, gradient-boosted trees (GBRT), and 3-seed neural-network ensembles on deviations from the regional shrinkage mean.
- Compare three training scopes for the 22 emerging markets: EM-only (
own), developed-to-emerging transfer (dm_only), andpooled. - Evaluate both statistical accuracy (out-of-sample R² and Clark-West t-statistics) and net economic value after 20 bp turnover costs.
- Run systematic robustness across shrinkage intensity (κ = 60, 120, 240), equal-weighted vs uncapped value-weighted factors, time-varying MSCI reclassifications, and U.S. macro state variables.
What the empirical run supports
| Strategy / Model | OOS R² vs own mean (%) | OOS R² vs shrink mean (%) | Net Sharpe (20 bp) | Interpretation |
|---|---|---|---|---|
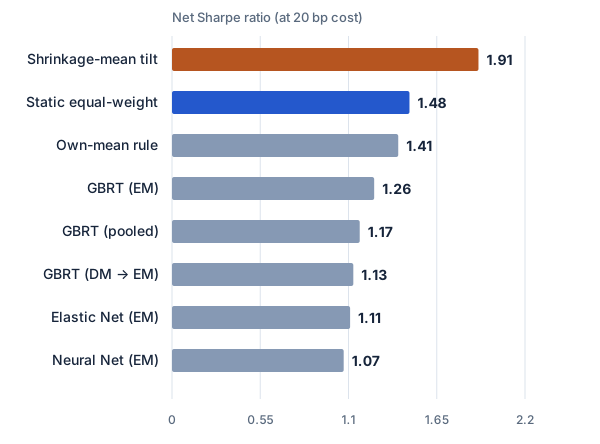
| Shrinkage mean (rule) | +1.20 | 0.00 | 1.91 | Pooling unconditional factor means across countries captures +1.20% OOS R² (t = 9.05) with minimal turnover (0.06/mo). |
| Static equal-weight | — | — | 1.48 | Passive equal-weight portfolio across available factors within each market (turnover 0.02/mo). |
| GBRT (EM own) | +0.99 | −0.21 | 1.26 | Positive Clark-West signal (t = 3.66), but forecast over-dispersion (slope 0.30) and 0.48/mo turnover reduce net Sharpe below static EW at 20 bp. |
| GBRT (DM → EM transfer) | +0.97 | −0.23 | 1.13 | Developed-market trees transfer directional signal (CW t = 3.79) without seeing EM training labels, but remain too dispersed for 20 bp turnover costs. |
| Elastic Net (EM own) | +1.16 | −0.05 | 1.11 | Closest learned model to the shrinkage mean on R², but linear timing evidence is fragile across κ and weighting specifications. |
| Neural Net (3-seed EM) | +0.83 | −0.38 | 1.07 | Positive directional signal (CW t = 1.82 own, 3.88 DM transfer), penalized by higher forecast dispersion. |
On equal-weighted factors, 7 of 9 learned models beat the shrinkage mean on OOS R² (up to +0.17%, CW t 3.8–5.0) and beat static equal weight net of 20 bp, but still trail the low-turnover shrinkage-mean tilt (3.90).
v2.0 Real-Data Empirical Validation (312 Monthly JKP Portfolios, 2000-01 to 2025-12)
| Specification | OOS R² vs Own (%) | Gross Sharpe | Net Sharpe (20 bp) | Turnover / mo | Max DD (%) | NW t (net) |
|---|---|---|---|---|---|---|
shrink_mean:rule (kappa = 60) | +0.9759 | 1.8337 | 1.7315 | 0.0648 | -3.26 | 8.19 |
shrink_mean:rule (kappa = 120 baseline) | +1.2025 | 1.9979 | 1.9054 | 0.0606 | -3.43 | 8.77 |
shrink_mean:rule (kappa = 240) | +1.3564 | 2.1325 | 2.0522 | 0.0558 | -3.60 | 9.15 |
eb_shrink_mean:rule (36m adaptive kappa) | +1.2116 | 2.0113 | 1.9186 | 0.0605 | -3.43 | 8.81 |
gbrt_rs:own (forecast-shrunk GBRT) | +1.1835 | 2.0937 | 1.7050 | 0.2436 | -3.80 | 7.63 |
turnover_damped_blend (75% k240 + 25% gbrt_rs) | +1.3131 | 2.1719 | 2.0122 | 0.1028 | -3.64 | 8.95 |
The blend has the highest gross Sharpe but not the highest net Sharpe: at 20 bp it reaches 2.0122, below kappa = 240 alone (2.0522), because it turns over 0.1028 a month against 0.0558. Its kappa = 240 and 75/25 weight were chosen after seeing these same 312 out-of-sample months, so the comparison is in-sample model selection. No committed script in the project repository generates this table (reports/jkp_em/eb_and_long_only_summary.csv).
Reproduce and inspect
Run make setup, make test, and make reproduce-sample for the synthetic verification slice, or place JKP factor archives in data/raw/ and run make run and make robustness.
Evidence boundary
- Out-of-sample predictive comparison (association), not causal identification of risk premia or behavioral mechanisms.
- JKP factor returns are gross of their own stock-level rebalancing costs and signed by the original studies; Sharpe ratio levels must be read comparatively.
- Baseline market classification is static MSCI; historical reclassification robustness does not model initial index inclusion dates.