Yang Xiao · Open Economic & Quant Monorepo

Economic questions.
Evidence-led answers.

I study how policies, incentives, and information shape markets across a unified 8-project monorepo powered by oeq-core, with daily out-of-sample trading tracking on crypto perpetuals and global emerging-market ETFs.

Applied economics · Causal inference · Live out-of-sample factor tracking

Eight questions I have investigated
Unified monorepo architecture

One codebase. Eight studies.
Shared statistical rigor.

All eight projects are consolidated in the open-economic-quant monorepo, sharing a core econometric & portfolio engine (oeq-core v0.2.0) and automated CI verification.

Layer 01 · Shared Engine

oeq-core v0.2.0 Infrastructure

Centralized statistical and portfolio primitives imported across subprojects with 100% unit-test coverage:

  • Shrinkage & Covariance: Empirical Bayes adaptive cross-sectional shrinkage & Ledoit-Wolf covariance regularization.
  • Inference & Multiple Testing: Newey-West HAC t-statistics, Politis-Romano stationary bootstrap, White Reality Check, and Deflated Sharpe Ratio (DSR).
  • Execution Shortfall: Turnover-damped weights, break-even fee solvers, and Almgren-Chriss square-root market impact.
Layer 03 · Live Verification

Automated Sync & Stress Audits

Every update runs verify_monorepo.py and sync_ecosystem.py across GitHub and Hugging Face:

  • 4-Part Live-Readiness Audit: Execution delay (0m / 1m / 5m / 1h / 24h), realistic 24-perp short hedge with 8h funding, capacity stress ($10k–$5M), and pre-trade bad-print guards.
  • Public Reproducibility: Pinned HF Dataset (917 files) & HF Space.
Live out-of-sample monitor · Updated 2026-10-29 00:07 UTC

Day-by-day trading results.

Realized out-of-sample returns tracked day by day across 105 crypto perpetuals (Binance Vision + OKX UTC) and 49 US-listed emerging/developed market ETFs.

Crypto Deliverable · Product B+28.41%537-day net return (+0.81 Sharpe) under realistic 24-perp short hedge, 8h funding & 1-min delay ($500k–$1M capacity)
Crypto High-Volume Reversal+8.54%October 2026 MTD net return (+9.66% since Sep 1), with +4.37% across the last 7 settled days (Oct 21–27)
EM Shrinkage Factor Tilt517–1,720 bpBreak-even transaction cost in 2026 OOS (+1.98% 2026 YTD tradable ETF excess return vs −5.71% EEM)
EM Conservative Investment+5.99%October 2026 MTD spread return (IWD − IWF), providing +3.09% crisis alpha during the Oct 22 equity sell-off

01 · CryptoFactors Day-by-Day Realized Net Returns (105 Coins, UTC Days)

Binance settled: 2026-10-27 · OKX UTC: 2026-10-28

Each column reports the net return realized on that UTC day from signals formed at the prior 00:00 UTC close (net of 10 bp round-trip cost for single factors and 15 bp weekly rebalance cost for Product B, including 8h perpetual funding accrual). During the Oct 22–25 deleveraging sell-off (Big-24 EW −7.70%), Low-Price Range gained +7.73% over four consecutive positive days and Product B Beta-Hedged gained +1.52% on the Oct 22 crash day; during the Oct 26–27 short squeeze, Taker Buy / Large-Trade OFI and High-Volume Reversal led.

Strategy / Factor / BenchmarkTypeOct 20Oct 21Oct 22Oct 23Oct 24Oct 25Oct 26Oct 27Oct 28Oct 21-Oct 28 (Settled)Oct 21-Oct 28Oct MTD (to Oct 28)Since Sep 29Since Sep 01
BTC Spot/Perp BenchmarkBenchmark+1.33%+1.28%-3.18%-0.28%-0.37%-0.91%0.00%+0.95%+0.53%-2.04%-2.04%-4.17%-2.78%+5.04%
ETH Spot/Perp BenchmarkBenchmark+1.71%+1.00%-3.42%-0.06%-1.21%-1.23%-0.23%+1.11%+0.39%-3.66%-3.66%-12.82%-11.89%-2.44%
Big-24 Equal-Weight BenchmarkBenchmark+1.84%+0.54%-4.72%-1.03%-1.56%-0.68%+0.29%+0.49%+0.68%-5.95%-5.95%-10.68%-11.07%+20.69%
Wide-105 Equal-Weight BenchmarkBenchmark+3.06%+1.16%-5.94%-0.91%-1.81%-1.69%+0.33%+0.82%+0.82%-7.19%-7.19%-13.14%-12.64%+17.76%
Product B · Top-8 Big-Cap Long-OnlyDeliverable+0.40%+0.70%-3.20%-1.03%-1.92%-1.15%+0.19%-0.14%+0.33%-6.10%-6.10%-11.00%-10.70%+22.41%
Product B · Top-8 Beta-Hedged (Market-Neutral)Deliverable-1.45%+0.16%+1.52%0.00%-0.35%-0.47%-0.10%-0.64%-0.35%-0.24%-0.24%-0.91%-0.15%+0.55%
v2.0 · 4-Factor Static Equal-WeightComposite-0.94%-0.06%+0.12%-0.05%-0.62%-0.10%-0.24%-1.09%-0.34%-2.35%-2.35%-1.23%-0.88%-3.28%
v2.0 · Inverse-Vol + Funding Squeeze GateComposite-0.91%+0.08%-0.26%-0.35%-0.77%-0.22%+0.16%-1.02%-0.08%-2.45%-2.45%+0.36%+0.09%-3.72%
v2.0 · Gated + 15% Target VolatilityComposite-1.11%+0.09%-0.31%-0.45%-0.99%-0.32%+0.23%-1.52%-0.11%-3.33%-3.33%-1.12%-1.31%-4.25%
Low-Price Range (AMP_lo, Wide-105)Single Factor-0.57%-1.15%+4.31%+2.45%+0.65%+0.14%-1.08%-0.36%-1.71%+3.15%+3.15%+3.43%+4.42%-6.63%
High-Volume Reversal (REV_hi, Wide-105)Single Factor-0.08%+0.75%+1.97%-0.34%-0.55%+0.55%+0.97%-0.01%+0.97%+4.37%+4.37%+8.54%+8.58%+9.66%
Taker Buy Ratio (OFI, Big-24)Single Factor+0.46%-0.01%+0.18%+0.55%-0.07%-0.81%+0.52%+0.83%-1.21%-0.05%-0.05%-0.77%-0.95%-13.62%
Large-Trade Taker Imbalance (OFI_big, Big-24)Single Factor-0.38%+0.41%+0.27%-0.14%-0.12%-1.09%+0.52%+1.25%-1.21%-0.14%-0.14%+4.18%+2.82%-16.83%
Open-Interest Change (dOI, Big-24)Single Factor-1.48%-0.02%-1.77%+0.15%-0.08%-0.45%+1.41%-0.44%+0.12%-1.10%-1.10%-13.13%-12.43%-20.40%
Cross-Sectional Momentum (MOM, Wide-105)Single Factor+0.99%-0.23%-0.69%-0.36%+1.02%-0.01%-0.90%+0.60%-0.30%-0.87%-0.87%+2.11%0.00%-8.46%
Top-Trader Long/Short Ratio (TLS, Big-24)Single Factor+2.24%+0.08%-1.67%-0.77%-0.35%-0.40%+1.12%+0.59%-0.59%-2.00%-2.00%-8.35%-8.25%+15.37%
Retail Long/Short Contrarian (GLS, Big-24)Single Factor-0.34%+1.01%-1.71%-0.81%-1.74%-0.24%-0.28%-1.39%+0.19%-4.89%-4.89%+2.23%+0.28%+4.87%
Funding-Rate Contrarian Carry (FUND, Big-24)Single Factor-1.35%-0.08%-0.34%-2.00%-1.29%+0.12%-1.00%-2.16%+0.05%-6.52%-6.52%+2.10%+3.68%+6.62%
Inspect pre-registered 2026-10-23 fixed-holdings signal book day-by-day (6 UTC days)
UTC DateBookBTCETHBig-24 EWWide-105 EWProd B Long-8Prod B Mkt-NeutralProd B Top8-Bot5Retail L/SFunding L/SLow-Price Range L/SReversal L/S
2026-10-23Frozen 2026-10-23 Book-0.28%-0.07%-0.76%-0.72%-1.14%-0.38%-0.31%-0.63%-1.69%+1.49%-0.16%
2026-10-24Frozen 2026-10-23 Book-0.37%-1.22%-1.48%-1.73%-2.02%-0.54%-0.75%-2.14%-1.27%+0.37%-0.58%
2026-10-25Frozen 2026-10-23 Book-0.90%-1.22%-0.70%-1.65%-0.96%-0.26%-0.25%-0.59%+0.55%+0.32%+0.41%
2026-10-26Frozen 2026-10-23 Book+0.01%-0.22%+0.41%+0.34%-0.04%-0.45%-0.97%-0.19%-0.82%-0.19%-1.28%
2026-10-27Frozen 2026-10-23 Book+0.94%+1.11%+0.27%+0.74%-0.17%-0.44%-0.82%-1.49%-1.38%-0.07%-0.45%
2026-10-28Frozen 2026-10-23 Book+0.53%+0.39%+0.68%+0.82%+0.68%0.00%-0.08%-0.32%+0.07%-0.14%+0.08%

Download CryptoFactors day-by-day CSV ↗ · Read Live-Readiness Stress Audit ↗

02 · EMFactorTiming Day-by-Day Realized Returns (49 US-Listed EM/DM ETFs)

Latest US trading session: 2026-10-28 (Settled Close)

Daily factor spreads and country ETF returns across 7 tradable global/EM style factors, 2 composite timing portfolios, and 21 MSCI EM country ETFs. On Thursday Oct 22 (when EEM fell −2.91% and SPY fell −1.18%), all six fundamental/defensive style factors rallied (Investment +3.09%, Low Risk +1.65%, Value +1.03%, Shrinkage Tilt +1.27%); across Oct 23–28, Momentum rebounded for four consecutive sessions (+0.83%, +1.05%, +1.13%, +1.06%).

Factor Spread / Timing Portfolio / BenchmarkCategoryOct 20Oct 21Oct 22Oct 23Oct 26Oct 27Oct 28Oct 22-Oct 28Oct MTD (to Oct 28)2026 YTD
Investment / Conservative (IWD - IWF)Style Factor+1.05%-0.69%+3.09%-0.23%-0.71%-1.06%-0.53%+0.50%+5.99%+5.05%
Low Risk / Min-Vol (USMV-SPY & EEMV-EEM)Style Factor+0.39%-0.30%+1.65%-0.25%0.00%-0.60%-0.69%+0.09%+3.65%+3.34%
Momentum (MTUM - SPY)Style Factor-0.29%+0.73%-2.49%+0.83%+1.05%+1.13%+1.06%+1.54%-5.41%-4.51%
Value (VLUE-SPY & DEM-EEM)Style Factor+0.34%-0.20%+1.03%-0.12%-0.43%-0.08%-0.77%-0.37%0.00%-0.07%
EM Multi-Factor (EMGF - EEM)Style Factor+0.13%-0.14%+0.05%-0.04%+0.25%+0.07%-0.34%0.00%+0.12%+0.24%
Size / Small-Cap (IWM-SPY & DGS-EEM)Style Factor+1.06%-0.29%+0.90%-0.16%-1.13%-0.02%-0.68%-1.10%-0.04%+0.25%
Quality (QUAL - SPY)Style Factor-0.13%-0.36%+0.53%-0.26%-0.38%-0.73%-0.41%-1.26%-0.94%-0.83%
Empirical Bayes Shrinkage Tilt (Defensive/Value)Timing Portfolio+0.47%-0.31%+1.27%-0.15%-0.35%-0.41%-0.53%-0.17%+1.62%+1.45%
Static Equal-Weight 7-Factor BasketTiming Portfolio+0.36%-0.18%+0.68%-0.03%-0.19%-0.18%-0.34%-0.07%+0.47%+0.50%
S&P 500 Benchmark (SPY)Market Benchmark+0.34%+0.53%-1.18%-0.52%+0.71%+0.56%+0.35%-0.09%+1.28%+0.89%
MSCI Emerging Markets Benchmark (EEM)Market Benchmark+0.02%+0.39%-2.91%+0.47%-0.31%+1.13%+1.60%-0.08%-4.90%-5.48%
EM 21-Country Equal-Weight BenchmarkMarket Benchmark+0.76%-0.01%-1.91%-0.40%-0.44%+1.06%+0.17%-1.54%-3.41%-4.49%
Inspect all 21 MSCI Emerging-Market country ETFs day-by-day (Oct 20 to Oct 28)
Country ETFUniverseOct 20Oct 21Oct 22Oct 23Oct 26Oct 27Oct 28Oct 22-Oct 28Oct MTD (to Oct 28)2026 YTD
QAT (QAT)MSCI EM Country-0.16%+0.49%-0.49%-0.74%+3.39%+3.98%-0.13%+6.04%+0.06%-1.72%
KOR (EWY)MSCI EM Country-1.65%+1.88%-4.98%+1.48%+0.97%+3.10%+5.35%+5.74%-9.25%-9.64%
KWT (KWT)MSCI EM Country+0.44%-0.84%-0.52%-0.71%+2.91%+0.93%0.00%+2.60%-2.80%-3.33%
MYS (EWM)MSCI EM Country+1.14%+0.26%-0.11%+0.23%-0.34%+0.30%+0.49%+0.56%-2.12%-3.14%
THA (THD)MSCI EM Country-0.80%-0.07%-0.04%+0.16%+1.19%-0.42%-0.35%+0.52%+0.92%-1.88%
SAU (KSA)MSCI EM Country-1.02%-0.66%-2.46%-0.03%+0.92%+1.82%+0.30%+0.51%-4.39%-6.02%
TWN (EWT)MSCI EM Country+0.07%+1.55%-4.59%+0.88%+0.68%+1.55%+1.56%-0.06%-3.53%-4.60%
IDN (EIDO)MSCI EM Country+7.18%+2.23%+0.95%-0.28%-0.75%-1.71%+1.26%-0.57%-10.74%-11.79%
IND (INDA)MSCI EM Country+0.80%-1.07%+0.19%-1.90%+0.28%+0.32%+0.15%-0.97%+0.28%-0.59%
EGY (AFK)MSCI EM Country+0.98%-0.37%-2.71%-0.66%+0.43%+1.09%+0.82%-1.07%-4.52%-6.23%
MEX (EWW)MSCI EM Country+0.19%+0.07%-0.79%+0.41%+0.05%-0.40%-0.48%-1.20%+4.99%+3.14%
ARE (UAE)MSCI EM Country+0.36%+0.20%-2.28%-1.14%+0.63%+2.56%-1.17%-1.47%-3.19%-3.81%
ZAF (EZA)MSCI EM Country+1.28%-0.18%-2.24%-1.13%+0.55%+0.83%+0.49%-1.51%+0.55%-0.21%
POL (EPOL)MSCI EM Country+0.27%+1.97%-2.13%-1.41%+0.21%+1.26%+0.09%-2.00%-0.32%-1.07%
GRC (GREK)MSCI EM Country+1.30%+0.21%-3.52%-1.54%+1.05%+1.59%+0.49%-2.01%-6.91%-7.14%
CHN (MCHI)MSCI EM Country+0.18%-1.79%-2.06%-0.04%+0.24%-0.08%-0.08%-2.02%-6.04%-6.66%
CHL (ECH)MSCI EM Country+0.73%-0.35%-2.29%-0.85%-1.22%+2.28%-0.55%-2.66%-4.34%-5.61%
PHL (EPHE)MSCI EM Country-0.26%-0.52%-0.83%-0.92%-1.20%+1.39%-1.55%-3.09%-2.11%-3.68%
TUR (TUR)MSCI EM Country+2.52%-1.32%-3.33%-1.22%+0.33%+0.03%-0.19%-4.35%-8.96%-13.18%
PER (EPU)MSCI EM Country-0.01%-0.85%-4.41%-0.71%+0.24%+1.29%-1.03%-4.62%-4.64%-5.40%
BRA (EWZ)MSCI EM Country+2.41%-1.00%-1.55%+1.77%-19.82%+0.44%-1.92%-20.87%-9.69%-7.10%

Download EMFactorTiming day-by-day CSV ↗ · Read EM Live-Readiness Audit ↗

Selected research

One question.
A method. A finding.

Start with the question that interests you. Each study pairs its conclusion with the evidence behind it.

01 Experiments & incentives

Who should get the offer?

A discount can increase activity. The harder question is whether a model can identify who will respond—and spend the same budget better.

What I found

The complex targeting model has not earned its advantage.

How I tested it. I test effect estimates against known answers, then compare spending rules at the same budget in simulated markets held out from training.

Semi-synthetic validation, not a measured effect of a real NYC promotion. The oracle knows the true average effect; it is a test benchmark, not a deployable policy.

Read the study →Explore the evidence ↗

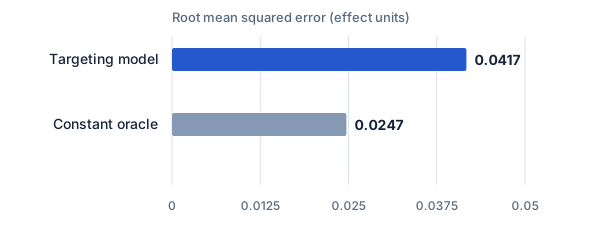
The model misses the simple benchmark

Effect-estimation error · lower is better

The model misses the simple benchmark

What this shows. The targeting model has more error than a constant benchmark that knows the true average effect. This test does not support a claim that the model reliably identifies who benefits more.

View published source ↗
02 Forecasting & information

Would the forecast work in real time?

Economic statistics are revised after publication. A model can look better in hindsight if its backtest uses numbers no one knew at the time.

What I found

Changing the data vintage changes which models look best.

How I tested it. I reconstruct official release histories and rerun forecasts with three information rules: data known then, revised values with the same availability, and unrestricted latest values.

The fixed-mask comparison is a hindsight diagnostic, not a valid real-time forecast. Results describe this pilot and its final holdout; they do not establish a universally best model.

Read the study →Explore the evidence ↗

Hindsight enters through two doors

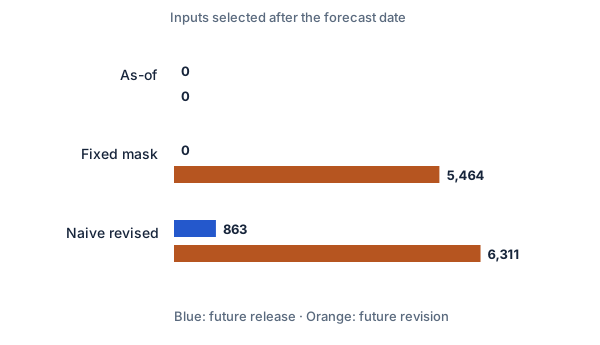
7,985 feature cells audited under each rule

Hindsight enters through two doors

What this shows. Strict as-of uses only information known at the time. Fixed mask keeps the original release availability but imports 5,464 later revisions. Unrestricted latest values also introduce 863 future releases. The two counts can overlap; do not add them.

View published source ↗
03 Housing & household finance

Does a cheap mortgage keep a loan in place?

When a new mortgage costs more than the one a homeowner already has, giving up the old loan becomes expensive. I study whether those loans are less likely to be paid off.

What I found

Bigger rate gaps are associated with fewer mortgage exits.

How I tested it. I compare monthly payoff rates across rate gaps, then estimate a complementary log-log hazard model with observed loan and local-market controls.

An association, not a causal estimate. Payoff and maturity are pooled; refinancing-related and sale-related payoff cannot be distinguished. Household moves are not observed. This is a selected Freddie Mac sample.

Read the study →Explore the evidence ↗

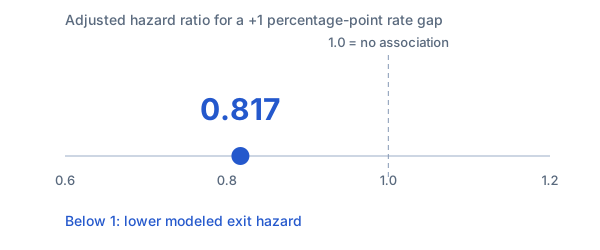
The adjusted association remains negative

Complementary log-log model · estimation sample, 2021–2023

The adjusted association remains negative

What this shows. A one-percentage-point larger rate gap is associated with an 18.3% lower conditional hazard in this model (1 − 0.817). This is a relative association, not an 18.3-point fall in monthly probability. No confidence interval is displayed; this is not a causal estimate.

View published source ↗
04 Trade & public policy

Who absorbed the tariff?

When the U.S. raises import tariffs, foreign suppliers could cut their prices—or importers could pay more. The distinction determines who bears the initial cost.

What I found

The evidence points toward higher costs for U.S. importers.

How I tested it. I compare each wave of tariffed products with never-tariffed products, tracking unit import values before and after the policy and checking three sample windows.

Unit values are not individual transaction prices. The duty-inclusive measure includes the tariff by construction; the pre-duty series is essential. Quantity fails its date-placebo check.

Read the study →Explore the evidence ↗

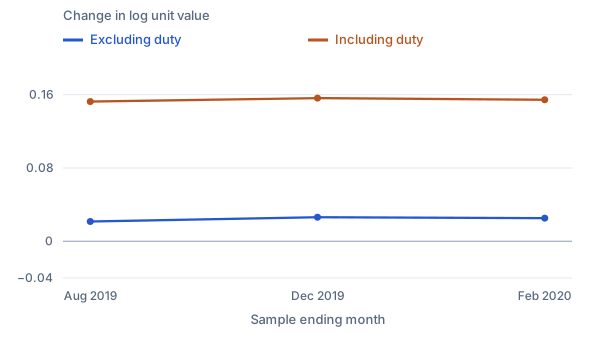
Duty-inclusive costs rise; pre-duty values barely move

Average post-tariff effect across three sample windows

Duty-inclusive costs rise; pre-duty values barely move

What this shows. The pre-duty effect stays close to +0.025 log points in all windows, rather than showing a large supplier-side price cut. Duty-inclusive effects stay near +0.15. Unit values are imperfect price proxies.

View published source ↗
05 Market microstructure

How much short-horizon edge does order flow carry?

Order-flow imbalance can anticipate small price moves. Measuring that edge properly means replaying it through realistic execution delays and an explicit fee hurdle.

What I found

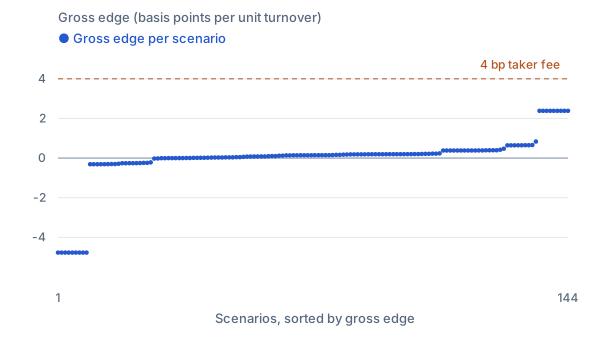
Order flow carries a positive gross edge in 110 of 144 execution scenarios.

How I tested it. I replay one four-hour BTC/ETH order-book capture across two evaluation phases, four horizons, and nine delay combinations, with a fixed 4 bp fee.

Exploratory simulation · research reference only · not live trading. The 144 scenarios overlap and are not independent experiments or a portfolio to add together.

Read the study →Explore the evidence ↗

Gross edge across 144 scenarios

Each dot is one fee-and-latency scenario · dashed line marks the fixed 4 bp fee

Gross edge across 144 scenarios

What this shows. Each dot is one scenario’s gross edge per unit of turnover, sorted from lowest to highest; 110 of 144 are above zero and the best reaches 2.39 bp. The dashed line marks the fixed 4 bp taker fee. Overlapping scenarios must not be summed.

View published source ↗
06 Emerging-market factor timing

Can machine learning time equity factors?

Factor returns vary over time. I test whether learned forecasts add value beyond a pooled, shrinkage-mean benchmark in emerging markets.

What I found

Pooling explains much of the apparent predictability.

How I tested it. I compare out-of-sample linear, tree, and neural-network forecasts on JKP global factors, test developed-to-emerging-market transfer, and evaluate timing after turnover costs.

Out-of-sample predictive association. Results depend on factor weighting and trading costs; equal-weighted factors differ. Factor returns exclude their own rebalancing costs.

Read the study →Explore the evidence ↗

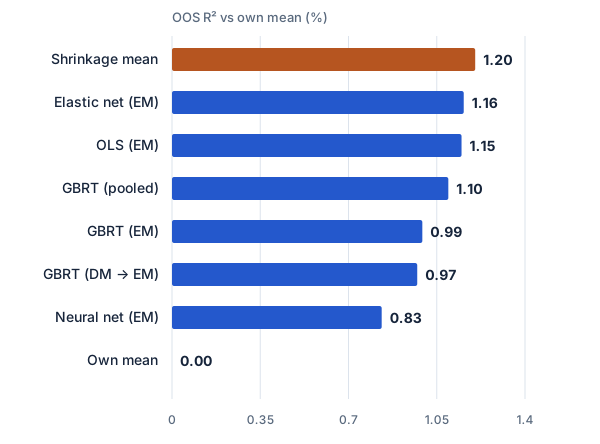
Shrinkage mean beats every learned timing model on OOS R²

Out-of-sample R² vs unpooled own mean (%) · 801,536 country-factor-months

Shrinkage mean beats every learned timing model on OOS R²

What this shows. Against the unpooled own mean, every model achieves positive OOS R² (+0.83% to +1.16%), but the non-timing regional shrinkage mean alone reaches +1.20% (t = 9.05). Measured against the shrinkage mean, all learned models have negative OOS R².

View published source ↗
07 Polymarket & prediction markets

Which prediction-market signals survive a realistic backtest?

Bounded prices, early settlement, and stale quotes can create apparent predictability. I study which cross-sectional signals remain after correcting those artifacts.

What I found

Reversal, volatility, and illiquidity survive the corrections.

How I tested it. I study 4,000 Polymarket markets, remove five backtest artifacts, control for price levels, and evaluate factor signs on a held-out half of the panel.

Backtest association, not live execution. Capacity is roughly $100–200 per position. The combined strategy weight was chosen in sample, and daily-close fills omit intraday slippage.

Read the study →Explore the evidence ↗

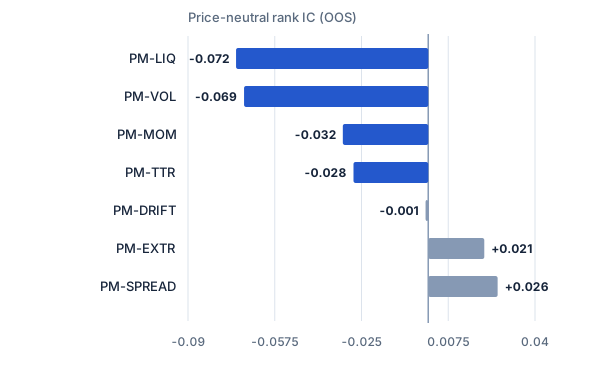
Illiquidity, volatility, and reversal survive price-level controls

Out-of-sample price-neutral rank IC · 54 five-day periods across 4,000 markets

Illiquidity, volatility, and reversal survive price-level controls

What this shows. After residualizing on [1, p, p²], illiquidity (PM-LIQ, IC = −0.072), low volatility (PM-VOL, −0.069), 30-day reversal (PM-MOM, −0.032), and time-to-resolution (PM-TTR, −0.028) remain statistically significant out of sample.

View published source ↗
08 Crypto funding & positioning

Do equity microstructure factors travel to crypto?

Crypto offers open minute-bar and perpetual-futures data. I test whether ideas from an A-share microstructure research series carry over to this different market.

What I found

Most factors do not travel; funding and positioning hold up better.

How I tested it. I test cross-sectional factors on 105 coins, check split samples and parameters, compare funding on OKX, and track the composite after publication.

Backtest and out-of-sample backtest association, not live trading. Fills at the close that completes the signal, with no execution lag or market impact; published long–short costs were under-charged by half. The sample is an altcoin bear market and the OKX check is short.

Read the study →Explore the evidence ↗

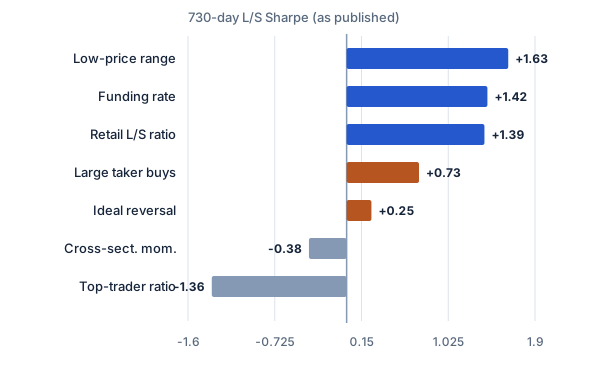
Funding, retail positioning, and low-price range transfer to crypto

730-day daily quintile long–short Sharpe as published (costs effectively ~2.5 bp/side, not 5) · 105 coins

Funding, retail positioning, and low-price range transfer to crypto

What this shows. Low-price range (+1.63), funding-rate contrarian carry (+1.42), and retail long/short positioning (+1.39) hold up across the 730-day Binance panel and OKX cross-validation, while cross-sectional momentum (−0.38) fails to transfer. The cost formula behind these published Sharpes charged about 2.5 bp per side instead of the stated 5 bp; read them as upper bounds until the rerun.

View published source ↗
Interactive evidence lab

Explore the details.

Compare metrics, inspect scenarios, and follow the source data.

Compare metrics and inspect individual scenarios
SEMI-SYNTHETIC · KNOWN-TRUTH VALIDATIONPredeclared recovery audit

Can a model identify who benefits most?

Semi-synthetic; not a live-market effect.

0.0417known-truth HTE RMSE
Method

Compare held-out effects with known truth and a constant oracle.

Finding

RMSE is 0.0417 versus 0.0247 for the oracle; no HTE claim is made.

Limit

Semi-synthetic; not a live-market effect.

CasualLab/artifacts/benchmarks/heterogeneity/hte_recovery.json
Loading the published signal…

Lower RMSE is better; the learner must beat the oracle.

Read the chart as a table
Behind the research

I build the path from question to evidence.

From assembling data and choosing a comparison to testing robustness and explaining the result. The code and public research artifacts are available alongside each study.

About my research →